Friday 23 July 2010

EURJPY - 5Min +22pips 1% Increase

Quickly checked 4 HR Chart, price was bullish Oversold with bearish cross.

Price action on the 5 min chart dropped below 60SMA, nonlag SMA + ALF Line.

Also both price action indicator's favoured a short entry, looked for Daily Pivot.

Price then halted just shy of Target, decided to close out with 1% Increase.

Wednesday 21 July 2010

GBPUSD - 5min - 2.6% 40 pip Loss

2.6% Account loss today! -40pips.

All the good work from the last few sessions gone, however its part of trading and something I need to accept and move on.

First mistake today, was a 130pip spike candle on the 5m chart (without any news scheduled).

This should have warned me to stay away for the day.

Anyway price rallied back to the open price, and the 130 pips candle was basically cancelled out, and my initial reading was long anyway so I decided to continue with my strategy for the day and buy a break of the high looking for my usual 20-30pips for 1%.

The dashboard was looking good as well, however as soon as price took me in, I was 10 pips in profit then retraced 35pips and I closed out.

Stupidly I re-entered 10 minutes later thinking I could at least get a rally back to my 1st position, then again news hit without me noticing it (second time now) and started to drop I closed out manually again for -5pips.

Total loss 40 pips 2.6% of my trading account.

****Should have walked today****

Tuesday 20 July 2010

GBPUSD - 5Min + 30pips 1.6% Increase

Price was moving lower, already below fib levels from yesterdays swing, also below both SMA's.

Price had consolidated on the 5 min chart, placed a sell order below market in anticipation of a move lower (.27 extension from yesterdays swing as a target).

Closed out at +30pips 1.6 Increase, very little or no draw down, however there was news released in the middle of my trade, that I didn't see coming or anticipate, which could have changed everything. Also moved to B/Even quite quickly after 10 pips or so.

Friday 16 July 2010

GBPUSD - 15Min - 4pip Loss (Rules broken)

All in all a bad choice of entry here, impatience to trade in the end, and then getting out too soon as the trade moved into profit.

4pip loss that was actually a +15 trade on the next candle, however the entry was poor and the the indicators / price action hadn't lined up.

I was trying to second the guess the market without confirmation, in the end this is just throwing away money on a hunch.

  • Retrace hadn't made it all the way to 38% level.
  • Previous move was 70 pips.
  • Trix was still bullish.
  • Indicators + Price were not in agreement.
One good thing was I closed out early, because I didn't like the look of things, hmmm lots more work todo.

Thursday 15 July 2010

EURJPY - 15 Minute Chart 18pips - 1.3% Increase

Indicator alerted me that price had touched the 240 + 60 SMA's (I was looking for a reaction from this level - very short-term)

Confirmation looked good between price action, 2 Oscillators and pattern formation (pin bars on the SMA).

So I took the trade, and got about 18 pips with very little draw-down only about 8 or 9 pips max.

1.3% Increase on trading account.

Wednesday 14 July 2010

EURJPY - 5 Minute Chart - 8pip LOSS

This was mega stupid trade, what am I trying to prove by pressing self destruct button ?

Selling Bottoms for 5 pips ?

Stupid, even tho my target was hit, I got spooked and closed the trade at -9.

Chart was showing slight divergence as well.

Also USD news hit a couple of minutes after this trade and price spiked 30 points, another reason not to trade during news events, even the ones that don't affect your currency.


See chart below :-


EURJPY - 5 Minute Chart +30

EURJPY 5 min Chart. +30

Down swing on the 5 minute chart broke the Asian session low, then retraced.

Price was below the 60SMA on 5 + 15 minute charts.

Measured fib from top to bottom of swing + projected 127 + 134 levels.

Fib swing + Asian low were grouped tightly together, so I figured good resistance place to enter, with stop above 38.3% fib.

Risk Reward was roughly 1.5 ish maybe bit more.

Monday 12 July 2010

GBPUSD - 15Min - Scalp +13

Along with the various trading techniques I'm experimenting with these days, this is my first real documented attempt at using the pip-ware dashboard.

The trend was down and I entered after a long retracement with a big bearish candle, price broke just above the '00' round number so I decided to look for a quick scalp down to the round number.

The trix indicator was bearish + also showing divergence, along with fractals showing bullishness. Made a quick 13 pips.

I'm also experimenting with a trade management EA that :-

  1. Closes 1/3 of the position at 10 pips profit.
  2. Moves the stop loss to BE at 10 pips profit.
  3. Closes 1/3 of the position at 20 pips profit.
  4. Target's 40 pips in total for the final 1/3 with the stop at BE.

I figure even if I'm wrong sometimes this could be a saving grace getting out quickly with small losses or even at BE.

I'm currently short the EUR/USD as well at the moment as part of a swing strategy, more to come when the trade develops (or gets stopped out).

Saturday 3 July 2010

EURUSD - Trade +93 pips 1.1%

Plus 93 pips today and it was NFP Friday as well!

Trade overview - I had counted a wave 3 rally from Thursday's low.

It seemed to me the EURUSD was mainly sideways on Friday morning due to it probably being NFP Friday, as well as pausing from yesterdays advance. However I was expecting one final push to make a (wave 5 of 3 high).


I'm still pretty new to this, so closed the majority of the trade early and only left a small percentage of the trade running.

However I still managed 1.1% account increase. My Entry was not bad with only a small retrace before moving in my favour, still need to practice the timing to get it 'slick'.

The top chart is the 15 minute execution chart, and the bottom (white coloured chart) is the higher 60 minute time frame.

As a reminder, this blog is really a trade diary for myself to get more experiance reviewing bad trades, and keep track of my success before 'going live'.

Tuesday 29 June 2010

AUDUSD - Update

Position update on the AUDUSD, price seems to be making a correction.

Potential ABC ? Before moving higher?

Monday 28 June 2010

AUDUSD - Possible 150+ Move

Looking at a potential 150+ point move on the AUD/USD live as of now.

It maybe in a position to complete a wave 5 high of a textbook, five wave impulse move.

I have identified 2 possible resistance zones at which price could reverse.

Wait and see.

Saturday 26 June 2010

Dynamic Price Zones

Look at this example on the GBPJPY from the 20th June to market close today, 1 Hour Data.

1. Fib the previous days high to low range.

External dynamic price zones are marked at the :-

1.27 to 1.34 + 1.55 to 1.61
-.27 to -.34 + -.55 to -.61 Extensions

Look how price has respected these zones for the best part of the trading week, lots of opportunity to trade and make some serious money here. Combine this with your other trading signals and you have some very powerful levels to project.

Try these Fibonacci levels for yourself and apply them to :-

  • Any Time Frame
  • Any Market
Also more often that not, price tends to reverse around these dynamic fib zones, Interesting Results!

Thursday 24 June 2010

EUR-USD Fib Level's - Intraday - 23/24thJune

So quick explanation of today's chart, back to the importance of fib levels.

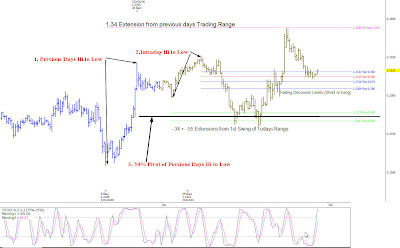
2 sets of fibs have been marked up onto this 15min chart of today's euro/usd.

1. Previous days High to Low (Blue Bars on the Chart. Which gave the 1.34 Extension Level (pink line)

2. Toady's High to Low as you would have seen at the start on the London session. This gave us the intra-day fibs marked as (decision levels on the chart short or long) and the green -.34 + -.55 extensions.

3. And lastly the black 50% pivot level of the previous days range (high to low).

Sounds a lot of marking + levels, however once you read up on Fibonacci, you'll quickly pick up the terminology and more importantly how price respects these mathematical levels.

So onto my analysis :-

From the London open, price breaks the 50% + 61.8% intraday fibs which indicates short. What area's could you potentially take profit at if you had taken these shorts ? well look at green intraday projections, these two levels are hit bang on.

This area is also the 50% pivot from the previous days high to low (Black Line marked 3). From here price finds support and starts to rally back up through intraday fibs (78.6 then 50 finally breaking the 38.2% level. Indicating potential long trade ?

Well if you reversed and took this long where could you take profit at ? Amazingly enough look at the 1.34 extension from yesterdays trading range (pink line).

Price hits this target to the pip!!!!! Amazing huh, all from Fibonacci projections in the past, predicting where price could go.

Trading is all about high probability entries, limited capital exposure with pre-defined profit target areas.

However its easy to markup charts after the day is over, real money makers trade these situations live with real £££ on the line, this is where the human emotions of fear and greed kick in.

Monday 21 June 2010

DT6 EOWave Scan's - EURUSD15 - Update


Interestingly enough after this analysis was performed during closed market hours (Sunday evening), the market gapped at the open 30+ pips.

It blew past the target zone for the Wave 2, was this due to closed market activity over the weekend gap trading hours ???

So I decided to keep watching anyhow, and to my amazement the Fib Levels were respected almost to the pip.

Moreover, all the levels had some significance in the Support + Resistance of this 150+ point move, knowing this before the event, was very powerful information indeed.

The only question is now how to put this info into profitable market entries with limited capital exposure.

Sunday 20 June 2010

DT6 EOWave Scan's - EURUSD15 Min

As explained on the chart itself, DT6's new wave scan routines have identified the end of a potential wave 2.

What comes after a wave 2 ? correct wave 3!!

And wave 3 is supposed to be the largest wave, so ill be keeping a close eye on this chart as the market opens this evening (Sunday 20th June) into Monday etc.

Updates to follow.

Wednesday 16 June 2010

Power Of Fibonacci Levels

I have used Fibonacci levels before, although I have to admit not really digging to deep and sticking with the standard retracement / extension levels.

On the quest for knowledge, which includes going back to the old days of trying every new system under the sun I uncovered some hidden or should I say more uncommon Fib levels.

Like 119 Support, 80.9 Resistance, Buy + Sell zones, 134 Bull Targets + -34 Bear Targets.

Today I spotted a trade on the GBPUSD 15 min chart that I entered and exited within 5 minutes due to 'fear and greed' however coming back to chart later on that evening I was astonished to see my projected target almost hit (5 pips shy). Nice 3:1 risk Reward. Fibonacci is definitely something I will be keeping in my trading toolbox.

Wednesday 9 June 2010

Trading Notes

Some notes from a book im reading, I though it would be a good idea to cut n paste them in here as and when I come across for future ref.

  • The business of trading is to identify conditions with a high probability outcome and acceptable capital exposure. We will not be right all of the time. But we should be right most of the time, and when wrong, the cost is acceptable.
  • The key is to identify if a market is making a correction. Why? If a market is making
    a correction, it should not take out the extreme that began the prior trend, but should
    eventually continue the trend direction prior to the correction and make a new extreme.
  • There is one simple pattern guideline that is very reliable to warn if a market is probably making a correction and not a new trend to a new extreme. If a market overlaps a section, more than likely it is making a correction. An overlap is when a market makes a new low or high, and then trades back into the range of the prior section. (see chart exmaple below)


Thursday 3 June 2010

My Education Continues

As the title states 'my education continues'

Recently I've found myself straying away from my usual techniques of identifying high probability trading setups based on ABC patterns and looking for simplistic Elliot wave type patterns, usually a wave 4 to 5.

I don't know why I have stopped doing this because I was pretty successful, all I know is that I'm 'reverting' back to type of trying a new system every few days, getting bored after a loss or two then moving onto the next best thing. Also I haven't been documenting my loosing trades on the blog lately, which isn't good at all.

So it's back to school until I'm more confident, basically I have no trading plan, entry, exit etc. Which is a recipe for disaster.

Which leads me onto this next screen shot of a book I'm reading......

So don't expect too many trades posted up until I get my head sorted.


- Posted using BlogPress from my iPhone

Wednesday 19 May 2010

GBPUSD - Wave 4 to Wave 5

Noticed a wave 4 to 5 forming on the GBPUSD15 minute chart today. My First attempt seen a double bottom off the original wave 4 high.

Was +30 pips before I noticed price stalling, and again I let it reverse and only made +7pips profit.

Then I seen price retrace to around 61.8/76.8 fib levels and shorted again with a 60 pip stop loss.

I should have learned my lesson from earlier today, and not re-entered after the double bottom, or at least verified against the higher time frames.

However I was wrong and stopped out at -1% loss and -60 pips. Poor trade management again, looking for a runner or my target getting hit. Last few trades I've had, i seem to have let my profits come back to zero, even a small loss.

Must get better at verifying the intra-day direction with higher timeframes, there's lots of money to be made everyday. Just need to be a better more disciplined trader.

Onto tracking the next trade.

Friday 14 May 2010

GBPUSD - Wave 4 > 5 - Conclusion

It seems this trade pretty much turned out as planned within 10 pips or so of my projected target.

You can see from the earlier screenshots this week, compared to this final screen shot that price did indeed move lower almost completing that wave 4 to 5.

Final thoughts, I had 60 pips in the bank on this trade and let them go back to zero looking for the full amount.

Also in placing a sell stop after missing out earlier in the week, I didn't plan my second entry and you can see from the above chart price moved 60 pips against me before moving in my favour, which would have probably stopped me out anyway on the second attempt.

So yes my projections were correct, however I need better entries in order to hold trades longer.
Also don't trade during Government elections + on NFP Friday! Doh

Onto looking for the next Trade!

Tuesday 11 May 2010

GBPUSD - Wave 4 > 5 - Part 2

After Fridays trade which was stopped out, I've been tracking this potential Wave 4 to 5, and seems to be bearing up for a potential entry at some point later today (short entry).

@12.46GMT
Sell Stop 1.46340 Target 1.44822 - 150 points.

Update Friday 14th May

I had been tracking this move all week looking for movement between wave's 4 and 5. Firstly on the previous trade (part 1 just below), this trade should NOT have been taken because of the volatile day (UK General Election and it was non farm payroll day in the states).

So a bad decision by myself and a recipe for a loosing trade, again another reason why stop losses keep you in the game.

Keep your loosing trades short, Crucially find tight entries and let the winners run!

Anyway, as I said before I was looking for another go at the wave 4>5 completion, and a potential entry point. After watching a retrace for most of this week, the move started to materialise late yesterday afternoon (Thursday 13th@16.40pm), I had placed a sell stop order below the market where i though price would move to, this proved to be risky as it knocked me into the market then retraced 60pips before moving back down.

~Note To Self~
Better Entries !!!!! Don't enter at the outer extremes of the Bollinger Bands !!!! Look for the retrace and some confluence closer to the center or the opposite band, depending on where you think the market is going.

(Confluence look for Good Entries cant stress this enough.)

So I was in the market, it then moved in my favour late on last night and into the early hours of this morning. I was +60pips during the night when i was asleep, however again it retraced back to my entry point by 8am in time for London open where I was stopped out at break even.

Will post update later on as market moves today. I have a feeling that my targets will be hit today all because of poor entries.

Friday 7 May 2010

GBPUSD - Wave 4 > 5 - Possibility

Seen another possibility of a completed wave 4 heading towards a wave 5 target. However it may be a risky move (or a risky time to enter late on a Friday during the election frenzy).

50p Stop with a 200p target 4:1 Risk Reward

Entered @14.27 Friday Afternoon.
Update @14.47 Stopped out 1% Loss.

Looking for another entry short.

Thursday 6 May 2010

EURJPY - Wave 4 > 5 - Part 2

So, stopped out on the 1st attempt earlier today at break even. Re-entered with a 30point or 1% risk, again looking for a bigger move (wave 4 to 5). After a slow'ish start which floated close to stoploss the position moved in my favour.

Closed 2/3's at 52pips for 1% increase and moved the stop loss to break even.

Left the other 1/3 running with a target of +120 will update later tonight @15.44GMT

Update @17:00GMT target 2 hit 0.02 lots at +179 for a total of 3.5% account increase. Not Bad for a days trading.

EURJPY - Possible Wave 4 > 5

Was looking for a possible move down from a wave 4 to wave 5. Entered after a pullback this morning and quickly moved my stop loss to break even after 10 min's, once I was at +30 points.

The move has the potential to go 100+ points if the wave 5 is completed as first though. However on such a tight stop loss I was taken out at breakeven.

Will watch with interest to what unfolds.

Wednesday 5 May 2010

Letting the Market Come to You!

I've been away from my PC for a few days now and not been scanning the charts for another trade as such. However its easy to look back through your charts and see loads of great setups that would have made you money had you been available at that particular time to take advantage of the move.

I'm guilty of seeing great setups and planning them out on paper, but not actually taking the trade, due to the fear factor. My trading physcology still isn't where it should be, to be truly successful at this game, It needs a lot of work, both on the discipline factor and the fear factor. Sometimes I get bored looking for trading opportunity's and just don't bother scanning the charts and giving them enough attention, only to see great setups appear that same day, or within a few hours.

That's trading in a nutshell, its not glamorous at all, but pretty boring most of the time until the right conditions appear, until then its a waiting game (discipline). I guess that's part of the secret to being successful, patience.

Let the market come to you, tick all of your entry boxes and then and only then enter your trade with good solid money management + risk reward. These are the real secrets to the "holy grail'.

Tuesday 27 April 2010

USDCHF - 60Min Long Setup Update 2

Update from last night's potential move on the Dollar Swiss. Was looking for completion of a wave 5 which started to materialise today around lunchtime.

Nice uptrend, no signs of weakness today.

Entry came on the 15 minute chart, with a classic swing low poking just outside the lower bollinger band.

20 point Stop
110+ Point Move (and still going) - @22:40GMT

I think there's more in this move, however I'm stalking the next trade.

Risk Reward was a massive 5:1. The real holy grail in trading is money management, tight stop losses and letting your winners run. 50% hit rate and still make money, that's your goal long term.

Monday 26 April 2010

USDCHF - 60Min Long Setup Wave 5 Target

After seeing weakness on the previous EURUSD position I'm just not feeling it for that trade. So onto another potential setup, this time on the Dollar Swiss.

Another Wave 5 with a nice target area, looking for it to break the previous ABC swing with nice momentum + confluence for an entry off the 15min chart. Again I'd be looking for a 20-30p stop max, shooting for 50-60pips.

2:1 Risk Reward. @22:00 GMT.

Friday 23 April 2010

EURUSD - Possible Setup @ Friday Close - Long

Looking at a possible retrace to complete a wave 4 then buying into the wave 5.

This is my first look at ABC Corrections and Elliot Wave so i could be completely off the mark here.

Anyway its Friday close currently 21:30GMT so the markets dead.

Interesting setup tho to follow the Sunday open.

Looking to go long for a possible 50pip move.

Update Monday 2150GMT - Just moving into high of the B from the ABC - weak signal + overbought could signal end of wave 5 at minimum target. Will give this a miss.

It's important to not 'fall in love' with your trades, if the setup fails move on, look for another opportunity, there will be plenty. Remember in trading you have 3 options, your long, your short or stand aside.

Account Update

Time for account status update.

Overall

EURUSD +28pips
GBPUSD +30pips
EURJPY +40pips

Need to manage risk reward better and leverage on trades, some trades have been under capitalised because I didn't know the base currency cross exchange rate i.e JPY

New Trades

+31pips @50% position size on GBPUSD
-30pips @ 100% position size on EURUSD
+40pip @50% position size on EURJPY

Previous :-

Weekly Update

+30 @ 50% position size
+22 @ 80% last 20 stopped out at even.
+23 @ 80% last 20 stopped out at even.
-17 @ 100% stopped out.

EURUSD Overall = +58

EURJPY 15m - Short - 1st Trade on JPY

Took this short last night @11:30pm GMT based on the downward look of the 1hour trend. Entered on a swing type trade with 27p stop looking for the end of the last swing at +60.

Firstly 10pips = £3.50 for 0.05 microlots, so may have under leveraged myself on that trade. Probably should be 0.1 micro lots for 30 pip stop loss to equate to my 1%'ish account risk.

Anyway made +40pips, could have had a better exit.

Still need to work at better in-trade management.

EURUSD 60 MIN - Buy

Took this trade against the trend, trend was down and I was expecting a rally for a quick'ish 30 pips.

Got Stopped out at -30pips.


Really shouldn't have taken this trade, everything was down and I bought ??? Still need to adjust my theory's and practices.

Lost nearly 2% on that Trade.

Monday 19 April 2010

EURJPY - Potential Long


Hmm looking at potential long trade setup on the EURJPY - 400 pip move ??

Wait n see I guess (On Major Waves Chart)

Buy into a falling market
Sell into a rising market
Correct?? who knows

Update 20th@10.17amGMT Currently +175

Update around 21//4/10 - +200 at 50MA

Nothing more left in that move, should have exited position at 50MA for +200

Didn't take this trade.

Friday 16 April 2010

First GBPUSD Trade

I need to be honest here, this entry was based from the MTP and not on my system. The Risk Reward was 5:1 and in the direction of the Trend.

I modified the rules slightly, to take out half the position @ 100% the initial risk then move the stop to even.

I made 1% account increase today or +31pips, again this could have been trebled if I had closed out when price wasn't breaking resistance.

I'm obviously still a fan of moving of moving quickly to break even + not sticking to rules.

All in All not bad tho - +31pips

Sunday 11 April 2010

My PC is dead

Using my pc last night and it suddenly powered off hmmm

Either dead psu or motherboard so no trading action likely this week.

Has this happened to you before ??? No pc means no business.


-- Post From My iPhone

Friday 9 April 2010

EURUSD - Trade 5 Short

Seen a similar trade setting up as the previous evening on the short side. Overall trend was looking down, so placed a short on a tight 15p stop.

Target was a healthy 75P to the previous swing low. However the trade was stopped out for a 15p loss.

Looking at both the 60 + 4hour chart, it seems we hit crucial support yesterday on the EURUSD and potentially a short term trend reversal.

Weekly Update

+30 @ 50% position size
+22 @ 80% last 20 stopped out at even.
+23 @ 80% last 20 stopped out at even.
-17 @ 100% stopped out.

EURUSD Overall = +58

Thursday 8 April 2010

EURUSD - Trade 4 Short - Tight Stop

Trying to sneak a move here on a tight 5 pip stop again. High chance of being stopped out.

Potential risk is 1 to gain 4 and leave 20% in the trade at break even.

Have I jumped in too early??

See how it develops (@12.04GMT)
Closed Position@Even - re-entered with wider stop and adjusted MM accordingly. Stop now 12 pips(@12:19)

Moved Stop to Break Even currently up +14 (@13:13)

Will leave trade till end of day see where it goes.

Update@16:52 - Stopped out at break even. Afternoon retrace perhaps, maybe another entry this evening.

Wednesday 7 April 2010

Decision Points - Updated Projections From Today

Update from earlier today, as you can see these area's highlighted in blue did play some role in support and resistance.

If price breaks these areas, I would imagine a suitable trade would setup.

Now, onto finding how to trade these areas correctly.

The 15min chart appears to have nailed the high and low areas for that swing, with the ame info reflected on the 60min chart.

Nice software huh ??

EURUSD - Trade 3 Short

Looked for Another Short on Tight Stop.

Seen possible entry on 1 min chart with a 4 pip stop.


Closed out 80% at +23 pips.


Second position floating +18, potential to drop if I get a runner. Note to self - Moved stop to B/Even at plus 8 or 9 pips.

Like the idea of free trades with low risk.

+43 pips today so far banked.

Update@21:10GMT - Second 20% stopped out at break even, was up +41 at one point, however wanted to see if a move was on, stayed inside a pretty tight range all day. Not bad results considering.

Decision Point - Projections

Live EURUSD 15min chart - Blue bars indicate potential swing points ?


10.38GMT

See how it develops.


Similar view from the 60m chart. Decision points highlighted in blue.

10.58 GMT

EURUSD - Trade 2 Short

Back to my area's of interest again, the pair trended down during yesterdays London session and early NY session, with a retrace later on in the NY session.

I decided to go short around 23:00GMT looking for the move down again during today's early London / London session.

My Entry was a bit premature, as I tried to get in early on a tight 16pip stop, however it proved to be ok (this time) - If I had waited another 90 mins for action to prove itself a better entry could have been had.

Woke up this morning to see myself around 22 pips up, decided to close out 80% get some profit in the bank and leave the rest at break even, see where the action takes me.


Tuesday 6 April 2010

Area's Of Interest


It's always easy to spot a good trade after the event has passed, I spend a lot of time looking at charts, trying to spot areas of interest around my trading system, when I would enter and how I would place my stop, which target I'd be looking at etc.


Isnt it strange how a lot of good trades setup during the night (Zzzzzz) ???

When I first started trading, I had a million different indicators popping up here, there and everywhere + sending me emails all over the place. Trouble was I didnt really have a solid system based around the alerts, price would move to an interesting area, then I wouldnt really know what todo with it.

Screen shot - area of interest on a 15 minute chart.

Now when i see these im looking for specifics after the event.

True areas of interest I guess can be usefull when you have a solid system in the background waiting ready to pounce for the correct setup + time, now lets see if I can snag a few this week.

Tuesday 30 March 2010

Trade 1 on EURUSD - Gap on Sunday 28th

Nice Gap trade setup on the euro-usd at this sundays open (around midnight UK-GMT). Seen the setup opended a position, set my stops and target then went to bed. Not much more to say on this one, usually I dont trade Gaps but I though what the hell. - Target was 30 pips on a 17pip stop, so roughly 1.7 Risk Reward.


edit... Trade Closed for +30 pips

The Rules According to Me

Ok so here it is people, I'm blogging to mainly help me focus on my forex intra day trading. I will be documenting the trades I take and my though process as to why i took those trades in the 1st place. I work from home (not forex trading) so my main focus is of course on my day job, however I will be scanning the charts and if I see a trade then................I'll take it and say why on here.

Firstly, my rules - will my system work ??? who knows but it needs to be tested thoroughly before i move on and change my life forever. So start small and work up from there!

My goal is to make 100pips per month on any given currency pair, when successful move onto the next currency pair until I have have 100 pips on all of them. Proof of concept if you like, before i move onto real money. Trading has the ability for freedom if treated correctly, I'm building life skills here, at least thts the way im looking at it.

The Pairs I'm trading are :-

EURUSD
GBPUSD
USDCHF
AUDUSD
USDCAD
EURGBP
AUDJPY
EURJPY
GBPJPY

First up will be EURUSD.